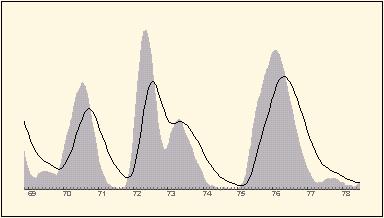
Grey solid: Superresolution
Green line: Kernel
Slow detectors and cuvettes with large volume smear the data output..
The example shows the effect of correctiong an exponetially relaxing dector's output.
In other words: The detector's input data are correctly recovered from the smeared output data.
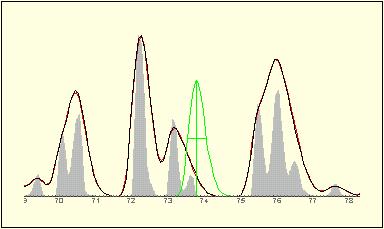
Digital superresolution can change sholders into baseline separated needles.
Especially tiny signals close to stron neighbours are worked out sharp and quantitatively correct.
Besides better readability for the analyst's eye, superresolution is an alarming system against peak impurities.
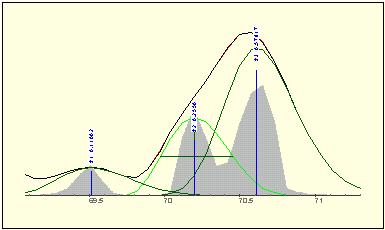
Iterativ decomposition of the data into analytical peaks hints to those positions, where in overlapped compounds sits of maximum purity is found.
The central peak at right obviously will dispaly the best spectum at t=70.1.
Moreover, quantitative treatment of the fitted overlap allows calculation of pure spectra from poverlapped ones.
High throughput optimization